April 26, 2015
Every 6 months or so another infographic appears informing us of the best times to post on each social media platform. Well I can tell you that most of these timings are unworkable. Useless insight that is meaningless. Why? Because the best times to post depends on a number of things, location being one of them! And as so many of these infographics are written for a US audience that they are irrelevant to the rest of the world.
The truth is that the perfect time to attract more engagement or drive more action is dependent on the sector you are in; your products and services; the audiences you target; and of course where in the world you are targeting. There are so many variables. Everything from the culture in your target country (commuting or lunch times for instance) to platforms being used (Snapchat differs from Facebook in usage).
The reality is that the right time to post on what platform is down to your own data, not that of a platform or generic industry samples. But understanding when best to post can be considered across platform and industry when you look at broader local trends and your own specific audience and industry data. And there are three ways you can use social data to identify the best times to post:
Tapping into topic trends and seasonality
The most obvious trend is that of topics: what do people talk about and when. Some industries have a natural seasonality, such as travel and fashion. But some, such as supermarkets, may not see such obvious peaks in interest. Whether you have trending topics or not though, you actually need to drill into the detail to understand how and when people are interested. It is more than broad topics that will give you the insights for posting times. Get into the nitty gritty and look for patterns that will help you predict spikes in the conversation.
Identifying when types of formats work best
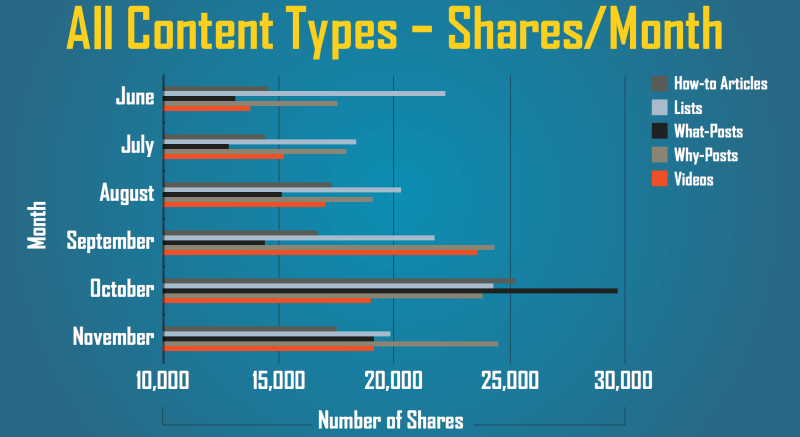
A new report by NewsCred looks at how and when to publish differing types of content. And the results, whilst still generic, make for interesting reading. For instance the data shows that ‘lists’ and ‘why’ posts are more evergreen than other types. Entertainment and educational videos did best in September, October and November. Gaining 22-35% social shares across sectors. So don’t just look at the content, consider the formats too when looking for trends.
By your customer purchase journey
Even brands with a short customer purchase journey can identify buying trends. Everything from raising awareness through to purchase peaks. Plotting your social customer journey in a linear fashion (we know it isn’t a linear path, but it is a framework to analyse the data) allows you to train monitoring tools to identify key triggers and phrases along the purchase path. The result is a deeper understanding of where, when and how your customers talk that also reveals the way they buy. The insight tells you when best to post particular themes and what calls to action to use.
Understanding your social customer journey in tandem with topic trends and formats gives you greater insight as to what will drive shares (reach), engagement and ultimately sales. Using all three together gives you a sharp focus on your content planning – saving you money and time.