March 21, 2017
According to Statista, there are 3.17 billion people online of which, 2.3 billion are active social media users. Yes, you read that right. That figure alone can trigger businesses to invest in social media, with the aim of reaching their target markets. Businesses want to be able to use social marketing strategies to maximise their potential reach & this requires careful planning, persistence, effort & measurement.
To quantify your social media strategy, it is important to identify KPIs (key performance indicators) that reflect your business objectives. These goals and benchmarks can help determine whether social campaigns are successful using informative metrics providing insight on social ROI. Simply put, metrics are sets of data and statistics that measure your social media marketing performance. This blog will help you understand some of the metrics that are used today. Whilst some are universal, there are also platform specific metrics and data can be used to differently across these platforms.
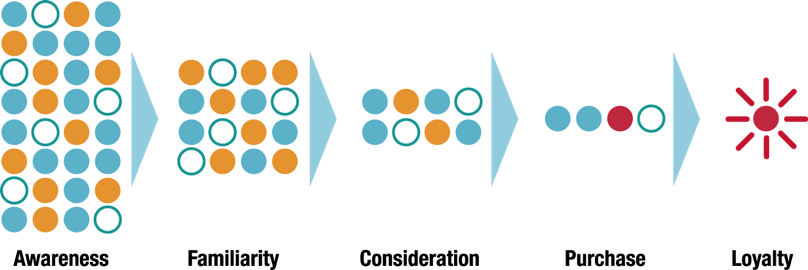
There are measurement opportunities at every stage of the customer journey:
- Reach Metrics – these focus on the audience’s and potential audience’s size, growth rate and how well your marketing efforts are tapping into that audience.
- Audience growth rate: The rate at which a brand adds (or loses) audience members per channel
- Post reach:The estimated number of people who see a specific piece of your content at least once during a period
- Potential impressions:The number of times a piece of content could be displayed, regardless of whether it is interacted with, during a period
- Engagement Metrics – these focus on the interactions and interests your audience has in your brand.
- Amplification rate: these are platform dependant and can include Retweets, Shares, Repins, Regrams etc.
- Engagement rate: This is the percentage of the total audience that has engaged with the social content
- Acquisition Metrics – at this stage, customers start to plunge deeper & are interested in what you offer. They are directed to your site and the numbers focus on their experience on your site.
- Blog Subscribers: number of users subscribed to your blog
- Bounce Rate: the percentage of visitors who visited your site, bouncing straight back to the place they came from rather than clicking further into the site
- Click-throughs: Number of clicks on a link within a post on a social platform
- Click through rate: The rate at which audience clicks on a given social platform. This is found by dividing the link clicks by the number of impressions for that post.
- Cost per click: Used in paid media
- Leads: The number of potential sales earned through a campaign
- Page Views: The number of pages viewed during a campaign
- Sessions: A group of interactions that take place on your website within a given timeframe
- Session duration: Total duration of all sessions/number of sessions
- Traffic: Number of visits and visitors the social campaigns drive to your site
- Conversion metrics – A businesses end goal is to convert a visitor into a conversion. This can be in the form of a sale, a subscription, a download and many more.
- Conversions: The number of actions you’d like users to take on your site e.g. subscriptions, downloads, registrations, sales etc.
- Conversion rate: The percentage of users who take a desired action on your site, found by dividing the number of conversions by total traffic
- Cost per acquisition: the monetary amount of how much a brand pays to attain a conversion
Social media is changing daily. As your brand becomes more competent in measurement and engagement categories such as conversation rate, amplification rate, applause rate, and economic value, it is important to note that what may have worked for one campaign, may not be effective for the next. It is necessary to create benchmarks and to understand the successes and failures from each campaign to be able to better the next. This will ultimately guide the allocation of marketing resources and offer a clearer path to quantifiable ROI.