March 5, 2019
Success on social media differs for everyone. Something we deem as successful may be viewed differently to someone else, and we all have various strategies to lead us to our victory.
Everyone can agree that high engagement rates prove your content has been effective, but which social platform does your audience engage the most on?
Recently, RivalIQ released their 2019 social media industry benchmark report, where they looked into 12 major industries and how they perform across Facebook, Twitter, and Instagram. They have reviewed each industry’s performance by engagement rate, posts-per-day, media types, and hashtags.
The 12 industries they’ve looked into are; Alcohol, Fashion, Food & Beverage, Health & Beauty, Higher Ed, Home Decor, Hotels & Resorts, Influencers, Media, Non-Profit Organisations, Retailers, and Sports Teams.
So, what can we take away from the report?
Across all industries, the median engagement rate is 0.09%, which seems pretty low! However as noted within the report, in 2018 Facebook changed its algorithm to show more content from family and friends rather than brands. Ultimately, most companies pulled back on the amount of content they post on the platform, which is evident in graph 2.
On Facebook, brands will have a wider audience, therefore making content that resonates well with each consumer is difficult. But there is more to the platform than posting content. Facebook gives brands the ability to interact with their consumers in a more personable way, allowing them to deal with customer service enquiries and build relationships with their consumers.
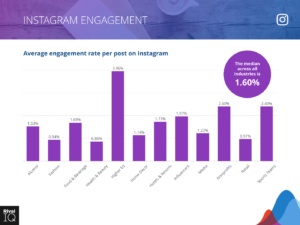
Instagram is the go-to social platform right now, for both business and personal use, and the median engagement rate from Rival IQ’s report is evidence of this. Instagram is a great platform to increase awareness and boost engagement for brands, as well as building consumer relationships.
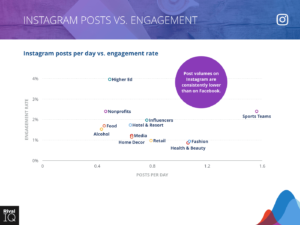
It is surprising to see that most industries don’t post as regularly on Instagram as they do on Facebook. However, by posting less content, brands have the ability to get it right, resulting in higher engagement rates.
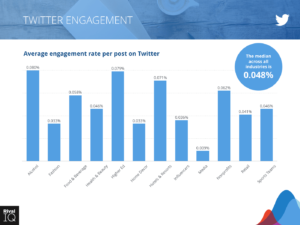
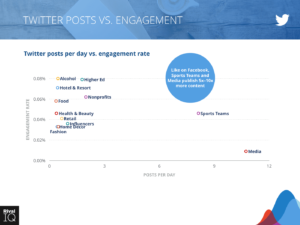
Similarly, to Facebook, brands are receiving low engagement rates on Twitter, but more content is being posted. Compared to the two other platforms, brands have the ability to join in more conversations on Twitter surrounding topics that don’t directly relate to their brand, but they’re raising awareness.
Whether consumers are engaging directly with a brand’s content or not, there are many other benefits to the platform. Like Facebook, consumers and brands use Twitter for online customer service, so it is definitely worth considering this platform when putting together a social media content strategy.
Within the rest of the report, Rival IQ found that photos receive the highest engagements on Facebook and Instagram, but videos are the highest on Twitter across all companies, except for Media and Non-Profit organisations.
Whilst the average number of posts per day on each platform differs for each industry, they all receive their highest engagement rates on Instagram, again, proving this is the go-to platform right now.