Social platform video comparison

It’s been said that a picture is worth a thousand words, and a video is basically lots of pictures, right?

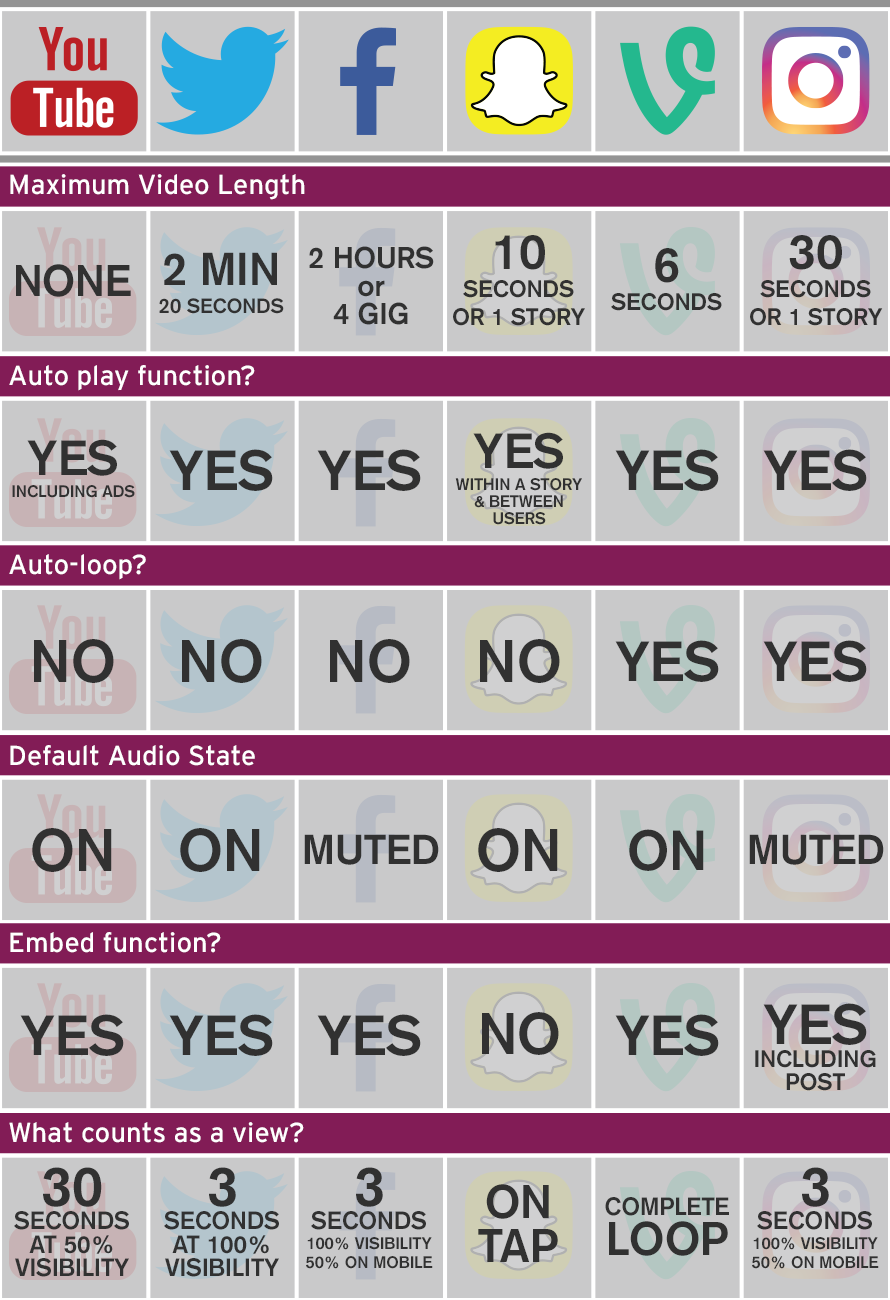
Every social platform has it’s own video content processes and rules, many of which are prone to change at the drop of a hat, effecting metrics and stats across the board.

So with that in mind let’s review how each social platform handles and delivers video content to users in 2016, from maximum length to auto-play function, here is a useful chart to help keep track of exactly how your video content will perform.

hm41-blog-infpgraphic

Sources:
https://uk.businessinsider.com/how-facebook-snapchat-youtube-vine-instagram-twitter-count-video-views-2016-10/#there-are-lots-of-things-to-consider-autoplay-time-spent-viewability-and-which-platform-the-user-is-on-3


https://marketingland.com/social-video-chart-your-at-a-glance-guide-to-7-major-platforms-130472

Latest Posts

The latest insights from Reuters into news consumption behaviours sees social media topping the table. We look into why this is, and how it’s all potentially come about. The 2026 Digital News Report from Reuters revealed social’s top place in the news standings – based off of…
Read More
Instagram is giving users more control over what they see in the app by expanding its “Your Algorithm” feature to the main feed. The feature allows users to tell Instagram which topics they want to see more of and which they’d prefer to see less of. Instagram…
Read More
A high-ticket sports brand achieved approximately 6x ROAS. That is a fantastic paid social result. The real story is how it was achieved. For any DTC marketer, a 6x ROAS result commands attention. For a high-ticket sports brand, where purchase cycles are longer, consideration is higher and buyers are naturally…
Read More