May 8, 2025
You hit your KPIs. You smashed your impressions. You even got a nice jump in site traffic. And yet…
…nothing. No extra budget. No nod from the board. Not even a “well done” from the CFO.
Why? Because your data’s doing all the talking and none of the persuading.
I get it. Most dashboards feel like they were built to confuse people. Crikey, even I’ve stared at a bubble chart and thought, what the actual hell is this meant to show?
So here’s the point. Data storytelling isn’t about making reports pretty. It’s about making marketing mean something to the people who sign off the money.
From charts to clarity. What data storytelling actually means
Barnaby Barron, Head of EMEA Analysis at Brandwatch, joined me on a recent LinkedIn Live to break this down. The bloke knows his stuff. He’s run global programmes for Sony and Microsoft, and he said something that stuck:
“Only 5% of people remember raw data a month later. But 60% remember a story built around that data.”
That’s not just stats for fun. That’s a giant red flag if you’re banking on your slide deck doing the work.
You can watch below, or you can scroll on for all the pithy highlights
A simple framework for storytelling in business
Barnaby shared a brilliant business version of the classic beginning-middle-end story arc:
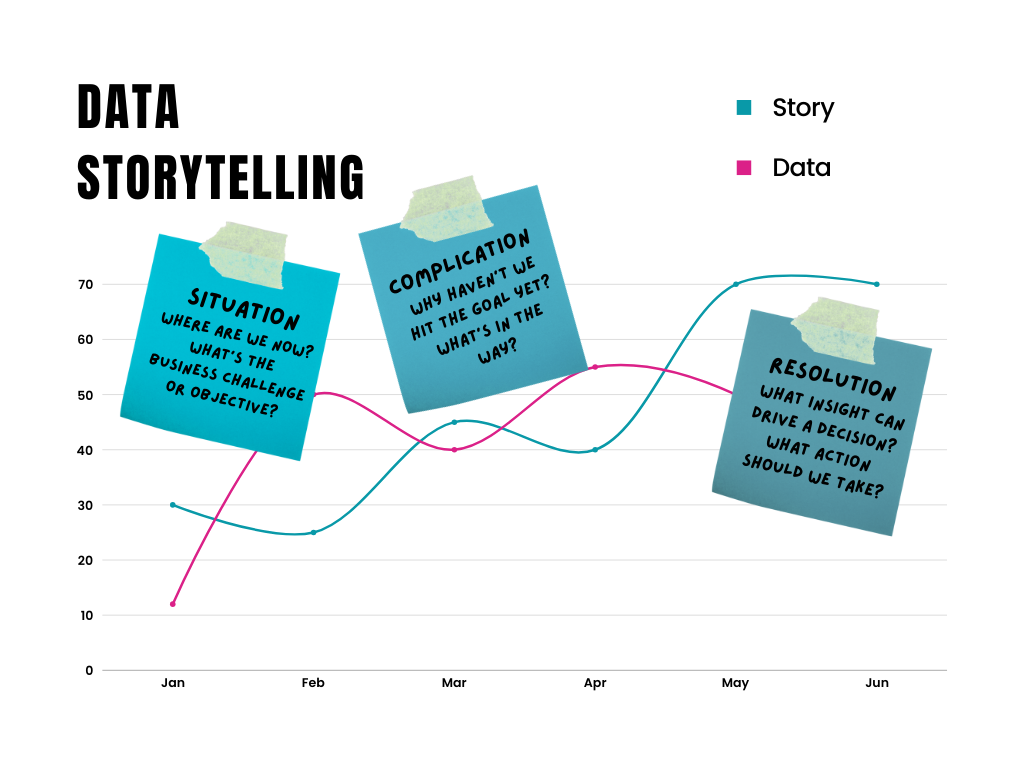
It’s storytelling 101, with a strategic twist. And it’s not just a silly narrative. It’s a way to frame complex data so people actually understand the why, not just the what.
The CFO doesn’t care about engagement
There was a cracking moment at 28:45 (In the video) where we talked about how to speak to the board:
“If you can’t draw a line from your objective to a business goal, you probably shouldn’t be doing it. And if you can’t explain it in 60 seconds, it’s not a link – it’s a leap.”
The board isn’t sat there hoping you’ll wow them with reach numbers. They want impact. They want clarity. And they want it quickly.
So when you’re building your story, ask yourself: what’s the one sentence that connects what we did to what the business cares about?
Here’s a more detailed blog on how to talk to CFOs if you want to dig deeper
Kill the sexy charts
Honestly, this one got a few chuckles, but it’s gold. Barnaby said:
“Charts have been around for 300 years. If there was a better way to do it, we’d have found it by now.”
Simple visuals win. Don’t get fancy. Don’t chuck in every axis and bubble just because you can. Make the data legible in two seconds flat. If someone has to stop and squint, you’ve lost them.
Emotion matters more than you think
This isn’t just for adland creatives. The science is solid. Data alone activates one part of the brain. Stories light up the lot – language, memory, even the bits linked to smell. Wild, right?
It creates connection. And connection drives action.
“If you’re reporting for the sake of reporting, you’re wasting everyone’s time. If your insight drives action – that’s when it counts.”
Top takeaways for CMOs
Whether you’re presenting to your CEO or lobbying for next year’s marketing budget, here’s what this means for you:
- Start with the story
Don’t tack on insight at the end. Build your measurement around the decisions you want to influence - Plan before you post
Metrics should be part of campaign planning, not just retrofitted at the end - Match your story to the audience
Some stakeholders want slides. some want a one-liner. write for them, not you - Keep your message tight
Barnaby’s research showed the more messages a brand tries to communicate, the lower the message cut-through - You can do a lot for free
Don’t let budget be the excuse. Google trends, Wikipedia data, native social metrics… all usable and useful [41:04]
And finally, stop retrofitting award entries
We’ve all done it. Your team’s worked magic but you didn’t measure it properly. So come awards season, you’re back-calculating uplift and trying to make a dashboard look like a story.
Stop it.
Plan your data like you plan your creative. Up front, with purpose.
Juicy bits worth skipping to in the video:
- 2:02 – why data storytelling matters
- 7:30 – the 5% vs 60% memory gap
- 12:05 – how to frame your narrative for the board
- 28:45 – what your CFO really wants to hear
- 35:42 – why retrofitting results never works
- 41:04 – what you can do with zero budget
Data storytelling isn’t about being all cute. It’s about making marketing work. And if your story lands, so will your budget.
Data isn’t the enemy. Bad storytelling is.